< All Articles
How to embed Excel Charts in a SharePoint Page
As I create Intranet portals for my clients, I often hear a need to embed Excel charts on a page. While you will get the best experience creating charts and dashboards with Power BI or the latest HTML dashboard with Copilot, you may already have the data and reports in Excel. Luckily, we can easily embed these reports on SharePoint pages. Let me show you how.
To do this, we’ll use the File and Media web part I blogged about here.
- Edit the page and add the File and media Web Part

- Browse to the Excel file on the site or upload it. Click Select.
- By default, the web part shows the whole worksheet with gridlines. To choose the Chart, click the Edit properties icon.
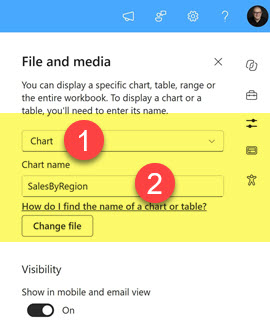
- Change Entire workbook to Chart, then choose the chart name (in my example, SalesByRegion).
- Republish the page to save the changes.
- This is the end result.

Nuances about embedding Excel charts
- The chart is live. When someone updates the data in the Excel file, the chart on the page updates as well
- Do not move or delete the file. The web part points to that specific file, and the chart breaks if the file moves.

Share Article