What is Power BI?
I am sure as you are working through SharePoint Online and Office 365, you ran into something called Power BI. What is Power BI and should you pay attention to it? This post will answer some of the questions you might have.
What is Power BI?
Power BI stands for Power Business Intelligence. In pure English, business intelligence means an ability to make sense of lots of data. Every day we deal with tons of data and information. Examples of data could be company sales, project data or customer information. To make sense of all this information, you might want to organize it into reports and visual dashboards people can understand. I am sure that you have either created or seen Excel pivot tables and pivot charts. These are simple business intelligence reports that allow you to slice and dice information any way you want. For those to work though, the data has to be stored in Excel. Now imagine a much more powerful tool that can connect to many different data sources that can create easy to understand reports and graphs. That tool is the Power BI application.
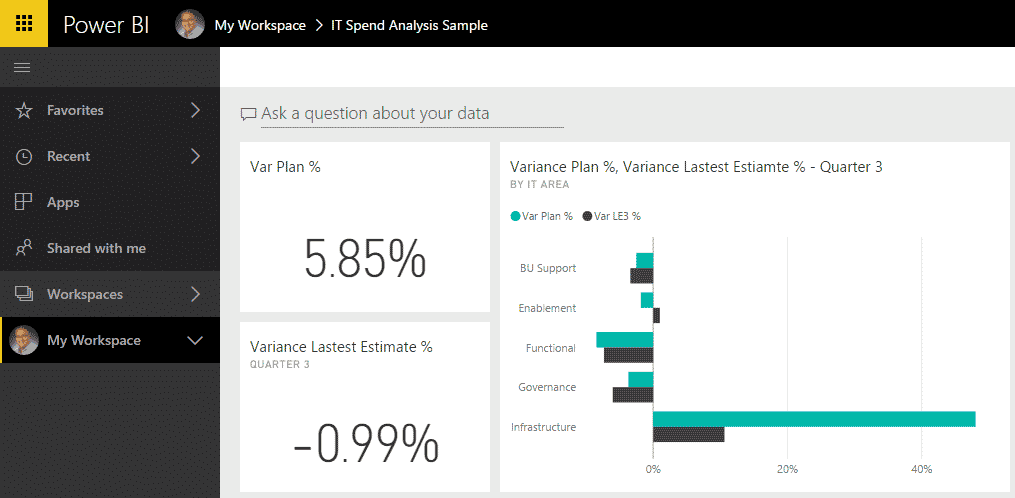
Sample Report displayed in Power BI Browser. Data and chart courtesy of Microsoft®
How is Power BI different from other tools?
What makes Power BI tool different from other commercial business intelligence tools is that it is easy to operate. Just a few years ago, if you needed to build some sort of business intelligence reports, you had to have expensive data warehouse tools, not to mention unique skill set (read: expensive consultants).
What makes Power BI different is that it has a very easy and intuitive user interface and building reports and graphs is as easy as working with Excel (well, not quite that easy, but you get the idea). Seriously though, if you are already an Excel guru and are comfortable working with Pivot Tables and Pivot Charts, you will feel comfortable working with Power BI.
How is Power BI related to SharePoint?
While Power BI is independent of SharePoint, both are tightly integrated. Let me explain.
Power BI is part of Office 365
First, as mentioned above, Power BI, just like SharePoint, is part of Office 365 family.
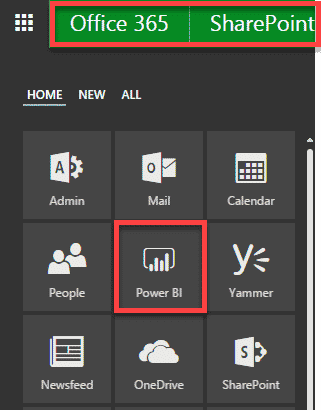
Power BI can source data from SharePoint
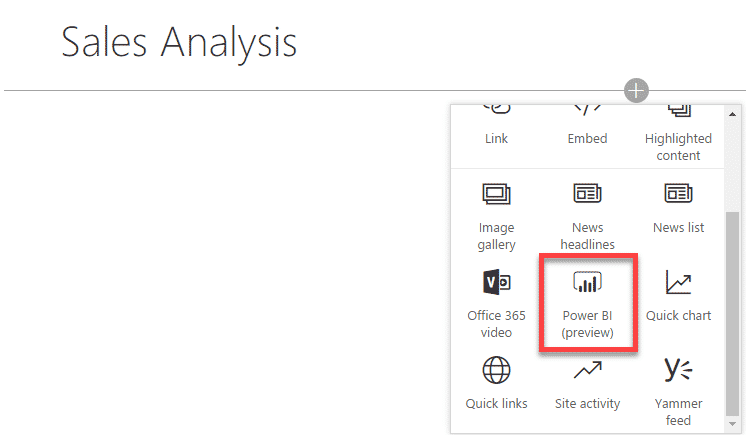
Power BI can “grab” data from multiple sources, like Excel, external databases, and 3rd party applications. It can also load information from SharePoint. The data can be stored in a SharePoint custom list or Excel document within a SharePoint/OneDrive Document library, for example, and be loaded/available in Power BI. Likewise, Power BI can also connect to Project Online so that you can run reports/graphs on any project data like tasks and resources and can build custom reports for your PMO, for example.
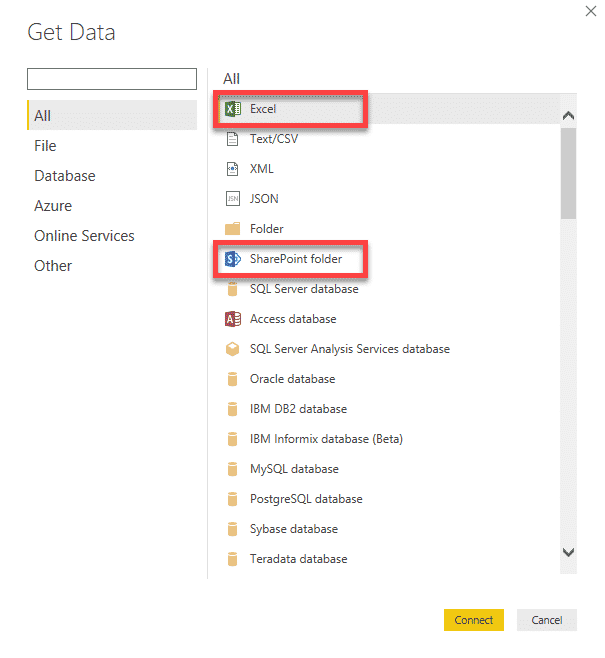
Power BI reports can be embedded into SharePoint Site/Page
Power BI reports can be embedded into a SharePoint page! That’s amazing because you can build your report in PoweBI and then have it available and displayed to the rest of employees as visual graphs or reports, making your SharePoint site fresh and worthwhile to land on!
How can I create reports and dashboard in Power BI?
There are two ways for you to work with Power BI.
Power BI via browser
The first option is for you to create reports and dashboards right in the browser version of PowerBI service.
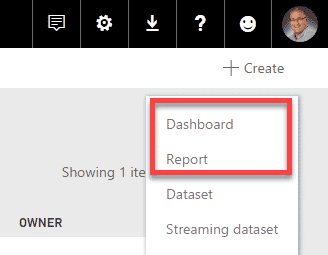
Power BI via desktop application
The second option is to download a Power BI desktop application. It has more bells and whistles and advanced functionalities comparing to the browser option above.

How can the users access and visualize Power BI Reports?
There are many ways for users to access and view the reports from Power BI:
- Via Browser (accessible via shared URL)
- Via SharePoint Page (if report has been embedded onto the modern page)
- Via Mobile App
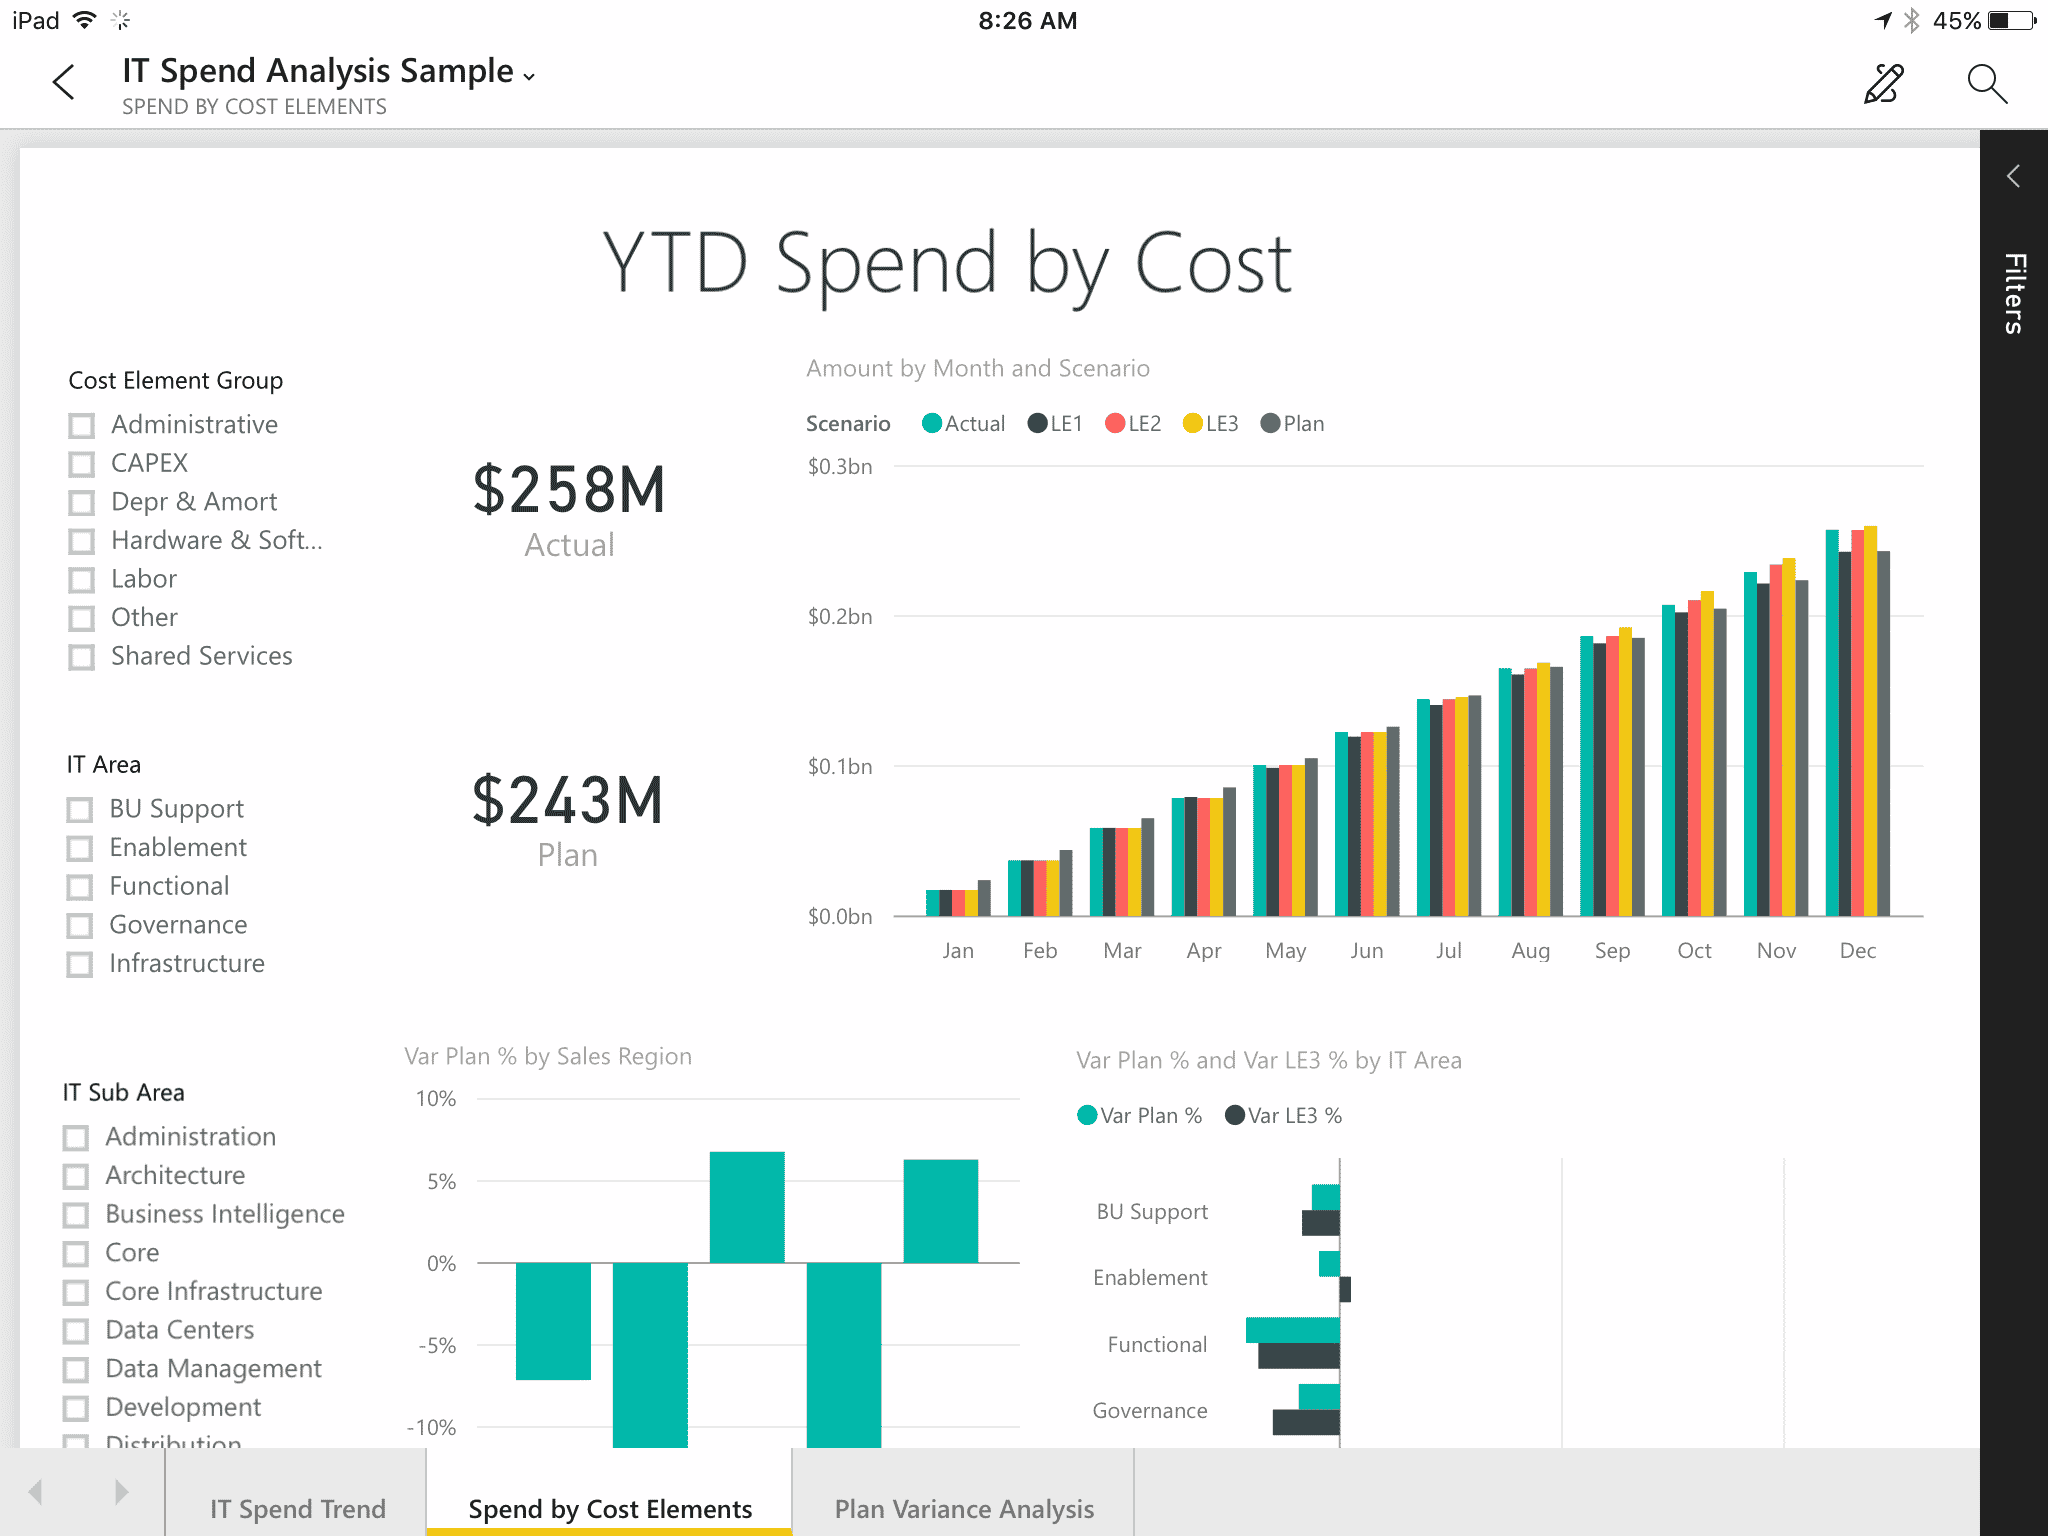
Screenshot of a report accessible via Mobile App on an iPad. Data and Charts courtesy of Microsoft®
Additional Resources
I plan to publish posts down the road on various tips and tricks related to Power BI. In the meantime, feel free to familiarize yourself with these wonderful resources from Microsoft:
