4 ways to display charts in SharePoint
A great way to spice up your SharePoint site is by adding some visual charts and graphs to it. I am a very practical kind of guy, so shiny objects and charts don’t excite me much, but hey, we all know your boss will love them, so let me show you a few tricks on how to display charts in SharePoint so that you can please their ego.
Now, let me be clear, all the tricks below apply to SharePoint modern pages. There are a few ways to embed the same on Classic wiki pages as well, but they are all cumbersome, and very time consuming to set up. You should not be using classic pages anymore if you are in SharePoint Online/Office 365. I told you I am very practical, so let’s not waste time on this.
Option 1: File Viewer Web Part
If you need something quick, this option is for you! It assumes that you already have some data stored in Excel (which many organizations already do). In this case, you can just embed it onto the modern page.
I happen to have a sample Excel document with some Sales metrics. I will use its data + chart for this and other examples in this post.

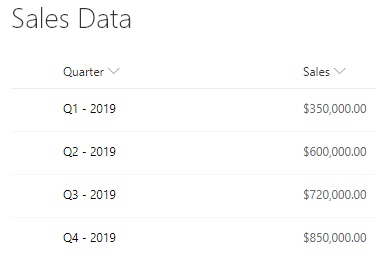
Table with sample Sales Metrics I have in Excel

Excel Chart for the data set above
So to embed the above onto a SharePoint Page:
- Edit the page, by clicking the Edit button

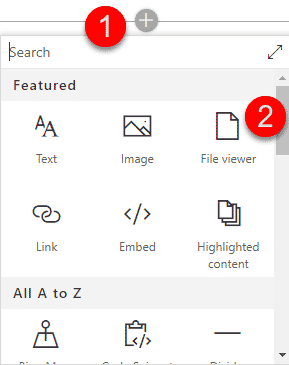
- Hit the plus sign to add a Web Part and choose File Viewer
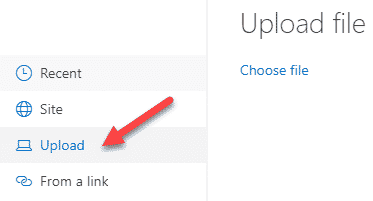
- Choose the Upload and upload the Excel Document you have
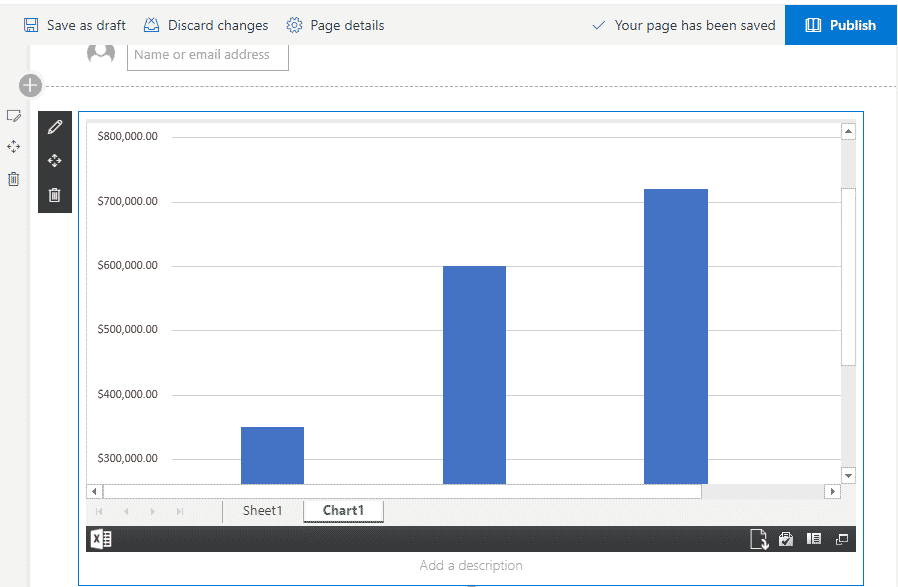
- Your chart will now be added to the page
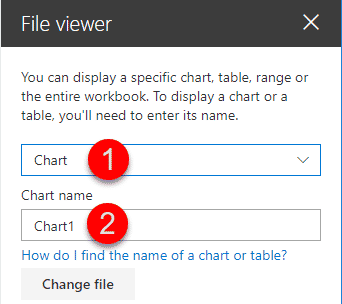
- Under Web Part Settings on the right, you have some options where you can control what and how info is displayed. For example, I only want my chart to be shown, not all the other tabs I have in my Excel document
- And this is what it looks like when it is all set and done. Mazel Tov, your boss should be feeling better already!


Pros
- Easy to set up, assuming you already have a chart in Excel
- Does not require much time to create
Cons
- Not much control over visual representation/rendering
Option 2: Quick Chart web part
Another option to display charts in SharePoint is to utilize Quick Chart Web Part.
- Follow the steps above to edit the modern page
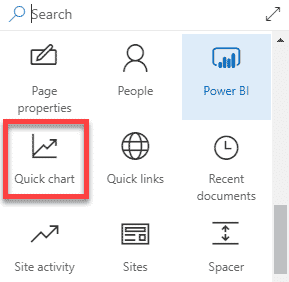
- From the web parts list, choose Quick Chart
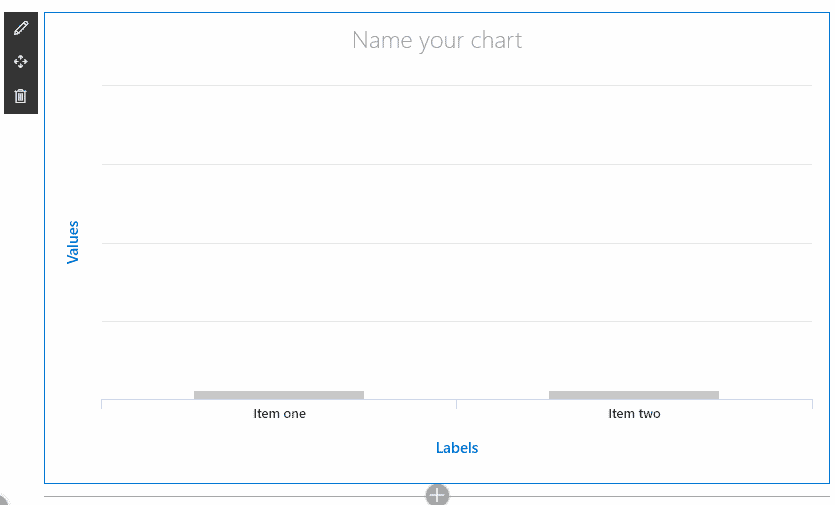
- It will add a blank chart area to the screen
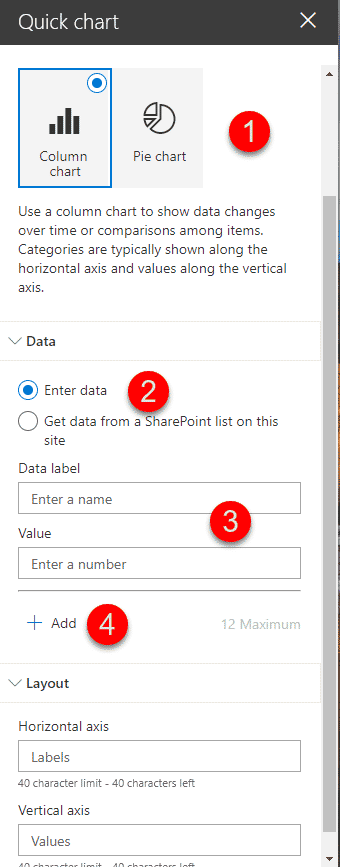
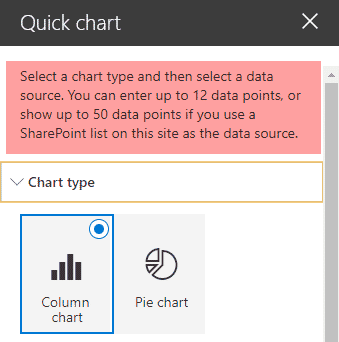
- On the Web Part settings panel on the right, you can specify the type of chart you want to build (Column Chart or Pie Chart). You can also specify whether you will be building the chart yourself entering data or getting the data from the SharePoint list.
- I would like to proceed with the SharePoint list option as it is the most elegant, in my opinion. Go ahead and build a custom list with your data. For instructions on how to build a custom list, please reference this post.
- Here is a SharePoint custom list I built based on my Excel document
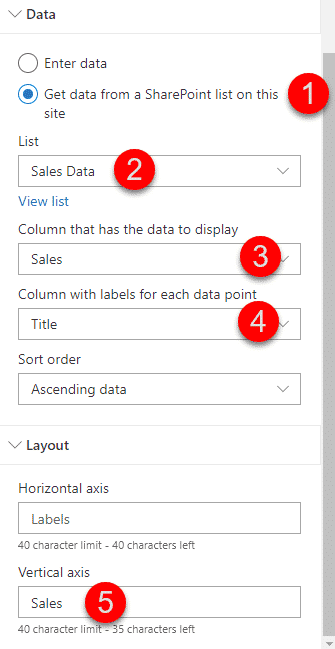
- In the Quick Chart Web Part properties screen, choose Get data from a SharePoint list on this site. Then select the list where data resides (Sales Data in my case). You then need to specify the columns where data resides, sort order, as well as labels for the axis. It is all pretty straightforward.
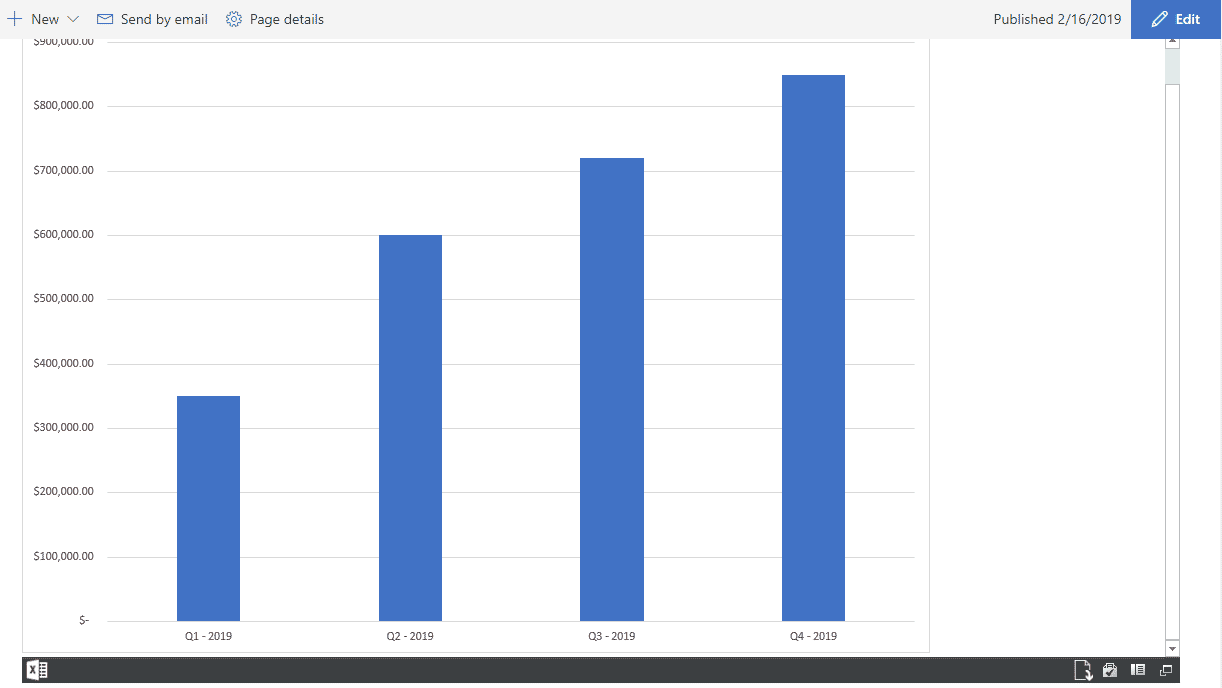
- And this is the end result
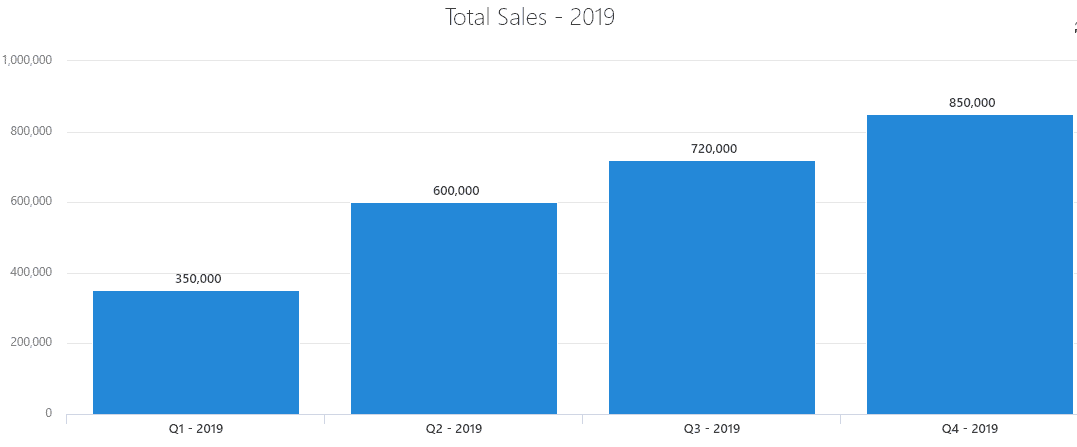
- Your boss should be ecstatic by now


Pros
- Not much harder than Option 1
Cons
- Just like above, not much control over visual representation/rendering
- There are some limitations it warns you about as you add the web part to the page (You can enter up to 12 data points, or show up to 50 data points if you use a SharePoint list on this site as the data source)

Option 3: Embed Power BI Report
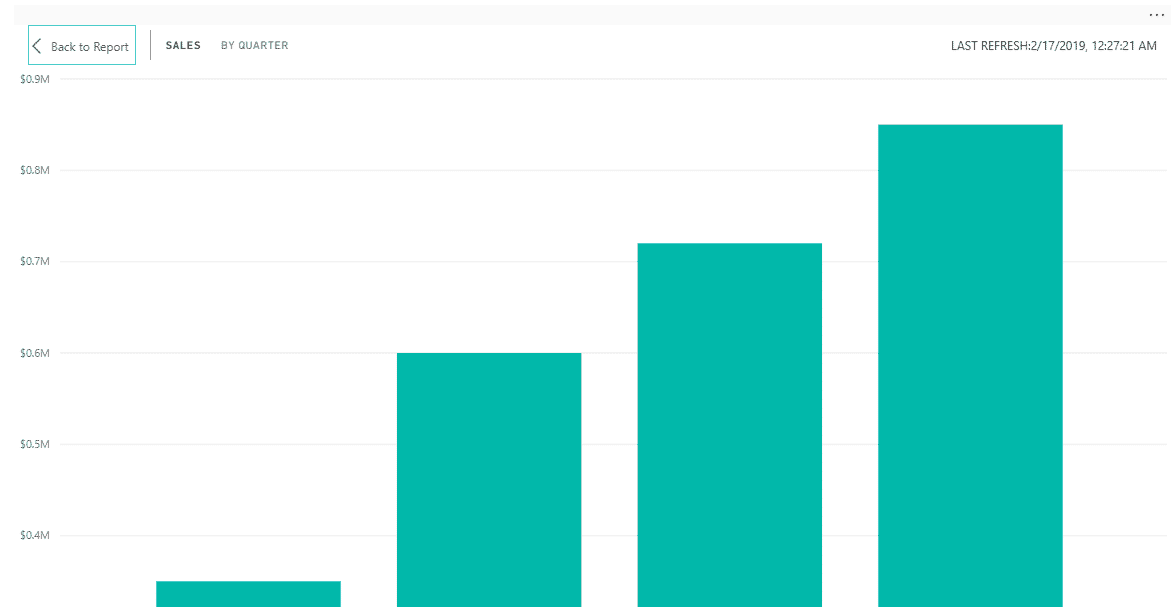
This option assumes that you have your charts and dashboard stored in Power BI. For some advanced reports and analysis, Power BI is the way to go. I created one behind the scenes, using the same Excel data above. For the purposes of this post, I won’t show the steps on how to create a Power BI report, probably a topic for another post. For now, I want to focus on how to add the existing report to the page.
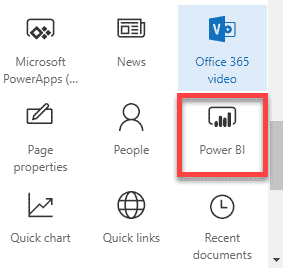
- Just like above, edit the page and add Power BI Web part
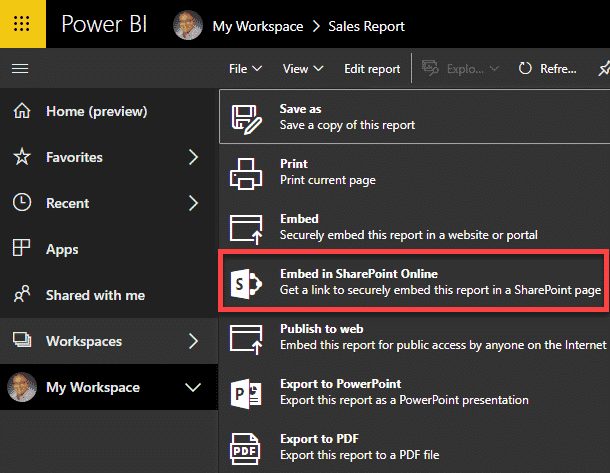
- On the next screen, you have to add the URL of the report. First, you need to generate a URL from within Power BI. To do that, click on File > Embed in SharePoint Online (NOTE: You need a Power BI Pro license to be able to generate a link for SharePoint)
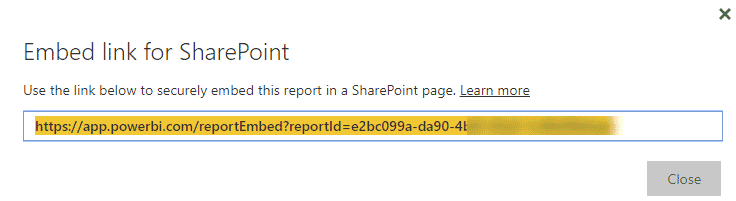
- On the next screen, just copy the URL
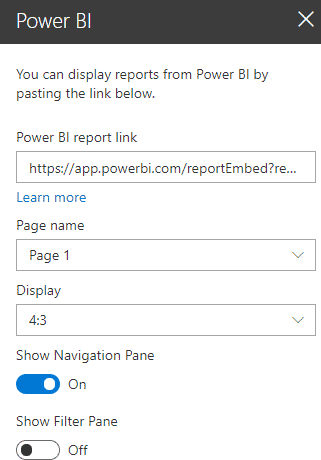
- Paste the URL, configure the available settings as necessary
- And the report is finally published
- Tell your boss you deserve a day-off for this!


Pros
- Power BI allows for some funky chart types and analysis
- Embedded reports are dynamic and interactive on a SharePoint page, just like in Power BI itself
Cons
- Requires know-how of Power BI to create awesome reports
Option 4: Embed Code Web Part
Another option you have, though not the most reliable one, is via Embed Code Web Part

The idea is that if you have your data elsewhere on the Internet, you can point to it via a URL or by pasting the embed code.

I did find this option to be rather cranky. It does not accept most of the URLs and unless you have an embed code, it won’t work. But, for example, I was able to embed charts from my Slideshare presentations. I believe this option is meant mostly for embedding videos on the page.

Share Article